17. Results
17.1. Optimization Results
The Optimization Results enables the visualization of the optimized shape in the display area after an analysis has completed. Furthermore, 3D mesh and model setups can be downloaded in STL, NASTRAN and ABAQUS formats.
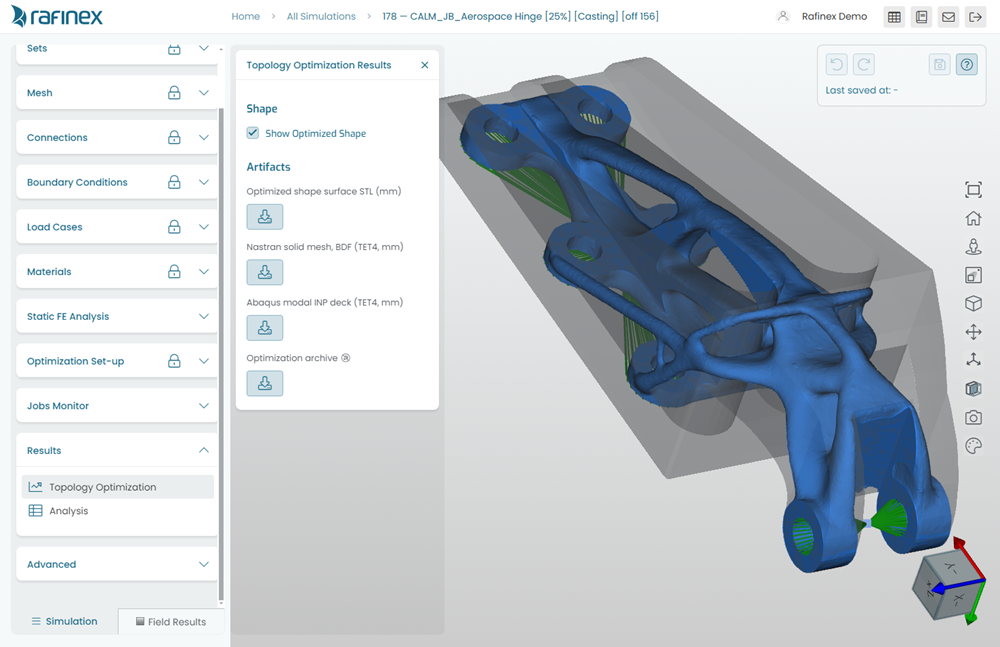
Fig. 17.1 Optimization results
17.2. FEA Results
The FEA Results panel lists the available solve archive file downloads for the preliminary and validation FE analyses. The results file format from Möbius can be opened using the free and open source ParaView post-processing visualization engine.
Note that the UI also features a 3D results viewer, as explained in the following section.
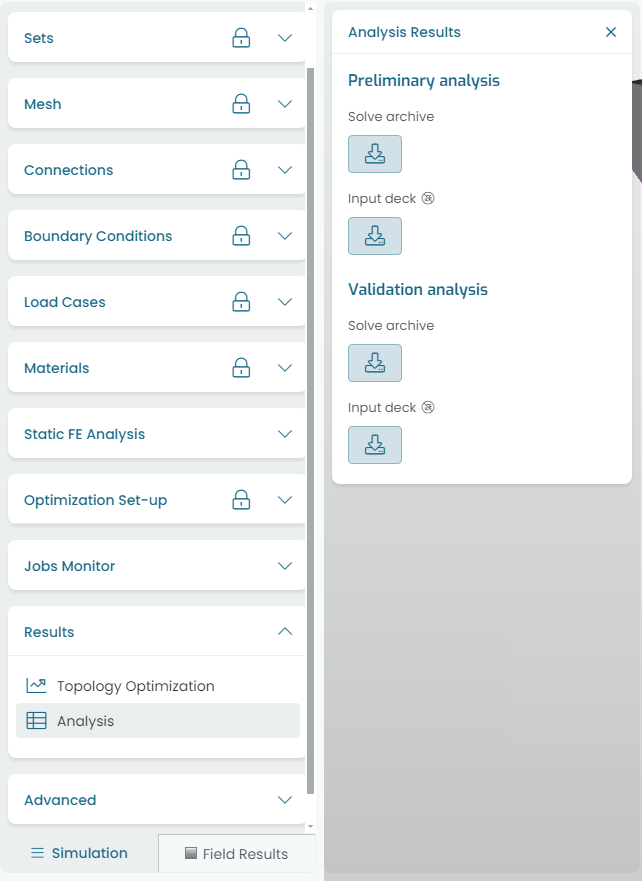
Fig. 17.2 FEA results panel
It is recommended to first inspect these results inside the Möbius UI environment. The 3D results viewer is accessible via the Field Results tab, located on the bottom-left area of the browser window.
Fig. 17.3 shows the field results viewer environment.
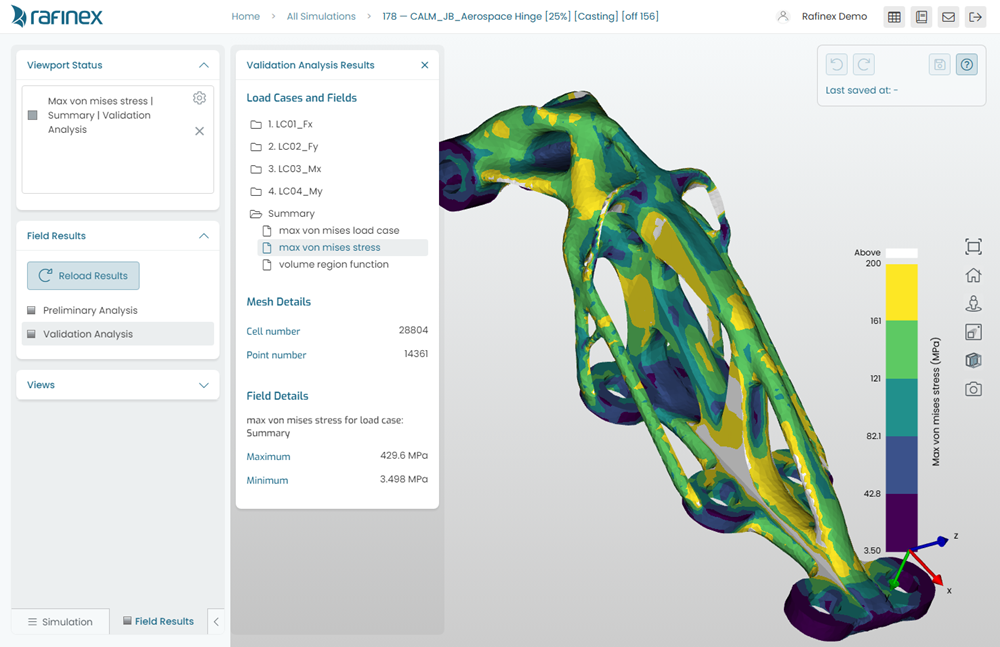
Fig. 17.3 FEA results viewer
Note
The FEA results viewer features a Summary load case, which comprises maximum von Mises stress levels from scanning all the load cases analyzed, and a field entry that displays which (worst) load case induced the peak stress values on each element; i.e. the killer loads.
The solve archive download contains an FEA text results file in CSV format (scalars.csv). This file comprises relevant metrics such as total strain energies (TSE) and stiffness values per load case. These results are key to understand the structural performance comparison across different design variants and an existing Baseline design.
Fig. 17.4 shows the type of charts with TSE breakdown on an assembly model. These results allow for fast & informed decision-making on what parts of an assembly design matter in terms of stiffness contribution.
Furthermore, they hint (at design concept stage) on what relevant parts are to be optimized first; i.e. what components have the highest strain energy contribution in an assembly.
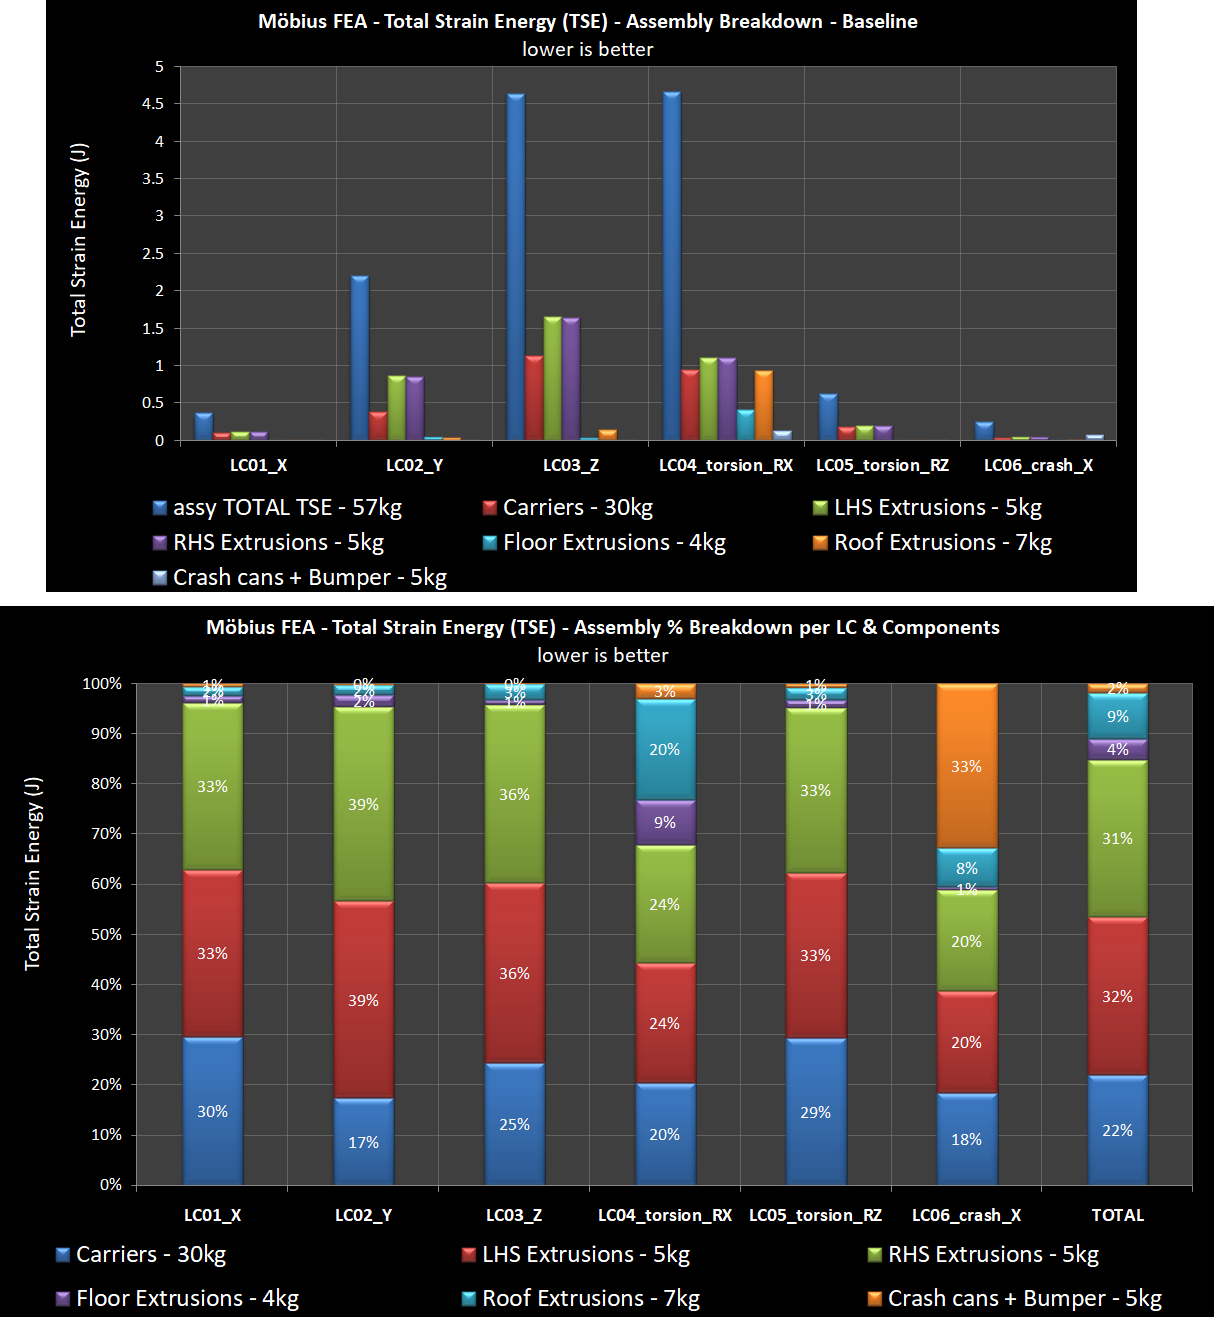
Fig. 17.4 FEA total strain energies
Fig. 17.5 shows a typical chart comparing TSEs across design variants in Möbius.
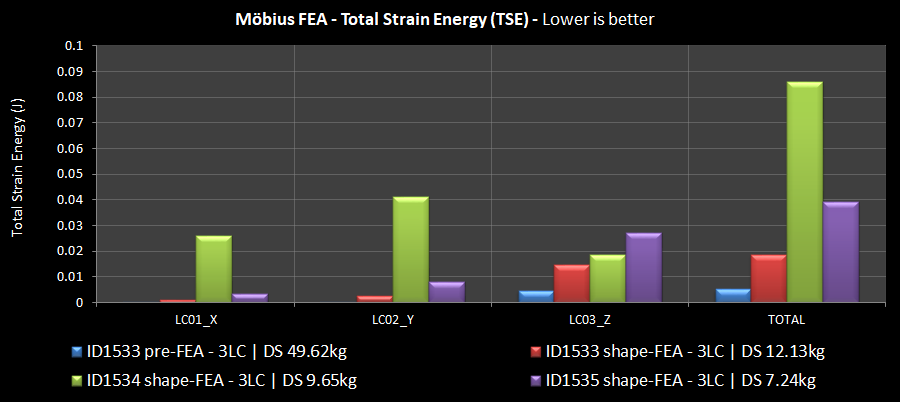
Fig. 17.5 FEA TSE across designs
Hint
The generation of these graphs/charts through the User Interface will be possible in the future, for rapid comparisons between structural performance results. This upcoming feature will complement the existing Results Table. These tools allow for fast & informed decision-making on a design direction, within a single analysis environment in the cloud.