4. Visualization
Fig. 4.1 shows the Möbius main application and visualization window. This is the entrypoint of any model after a successful geometry import.
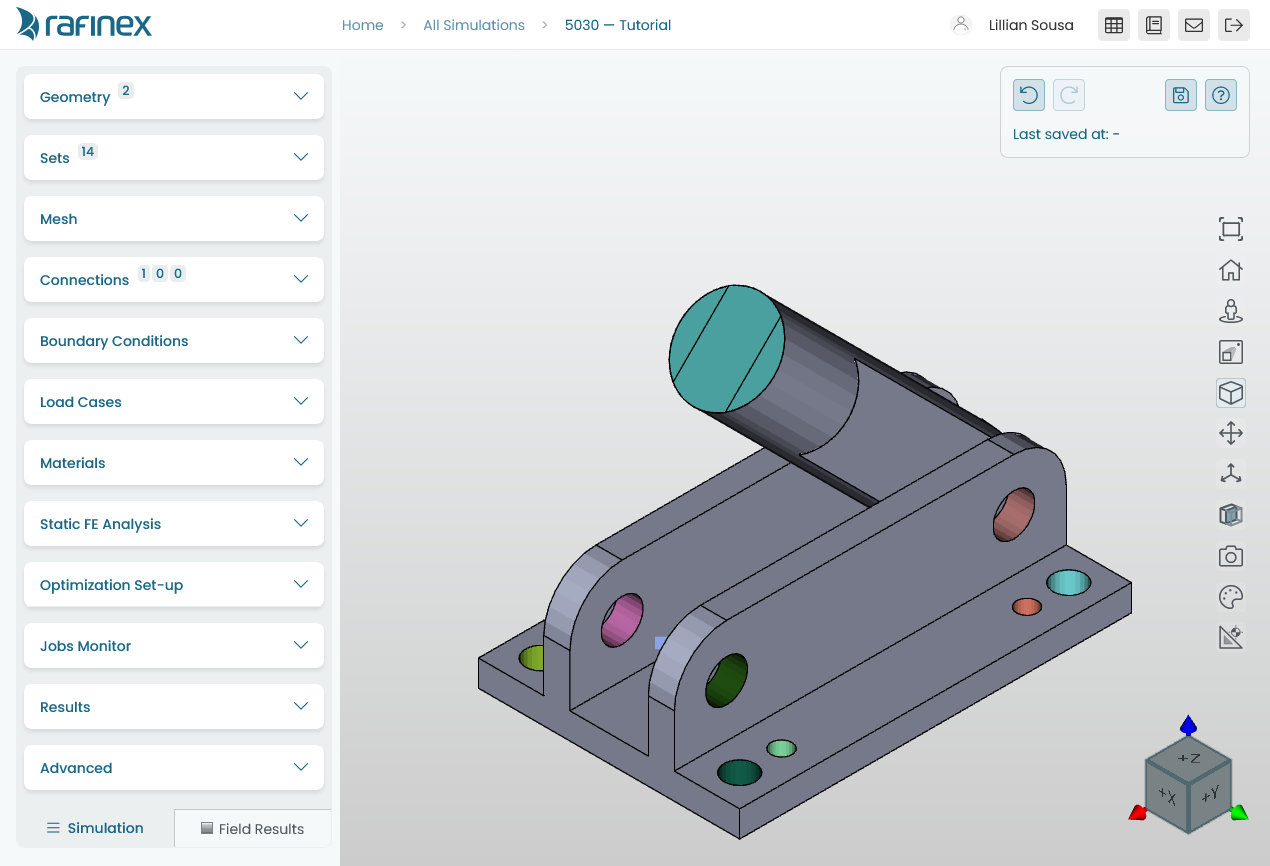
Fig. 4.1 Möbius visualization
This application allows for visualizing and defining all components that are part of a model setup.
The main components of this application can be quickly identified:
a header containing the simulation title and shortcuts to other platform components, documentation, and support contact,
a control panel containing all components of a model setup with basic entity counters,
a central visualization area where the geometry, mesh, optimized shape, or results are displayed,
a model history panel at the top right of the visualization area, and
a series of visualization tools listed on the right of the visualization area.
4.1. Model history
The History panel with buttons to Undo, Redo, and Save the current state.

Fig. 4.2 History panel
Tip
The model can also be saved using the keyboard shortcut: Ctrl + S
4.2. Visualization controls
The central area can be used to interact with the model geometry according to the User Controls. The help icon within the history panel will bring up this reminder.
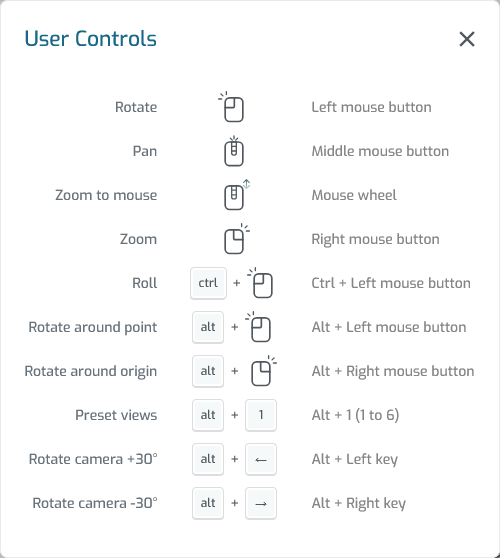
Fig. 4.3 User Controls
4.3. Visualization tools
At the right of the visualization area, several buttons allow for quick actions on the active geometry. The description of each is depicted in Table 4.1.
|
Zoom to fit |
Fits the active geometry within the visible viewport |
|
Reset view |
Resets the view to the default |
|
Views |
Switch between pre-defined axis-aligned views, or rotate the current view around the normal axis |
|
Perspective |
Switch between parallel and perspective view |
|
Edges |
Show or hide geometry edges |
|
Bounding box |
Render an axis-aligned bounding box with respective dimensions and corner coordinates |
|
Origin |
Show or hide a triad at the global origin (CSYS) |
|
Section view |
Toggle the Section view controls |
|
Screenshot |
Opens the screenshot window which allows for easy screenshots of the underlying geometry without the visualization controls |
|
Color by |
Color the geometry automatically, by distinct volumes or materials, or set colors |
|
Measure |
Toggle the Measure tool window which allows for simple operations on geometrical entities |


4.3.1. Section view
The section view changes the geometry render by sectioning its respective faces. Edges are still displayed in full if enabled. An example is shown in Fig. 4.4.
The section plane is defined by its origin coordinates and a normal direction. These can be specified using the section view controls. The checkbox inputs allow for setting planes in the positive or negative directions of the principal axes. The sliders allow for easily moving section plane along each of these directions. Custom normal specifications are also supported.
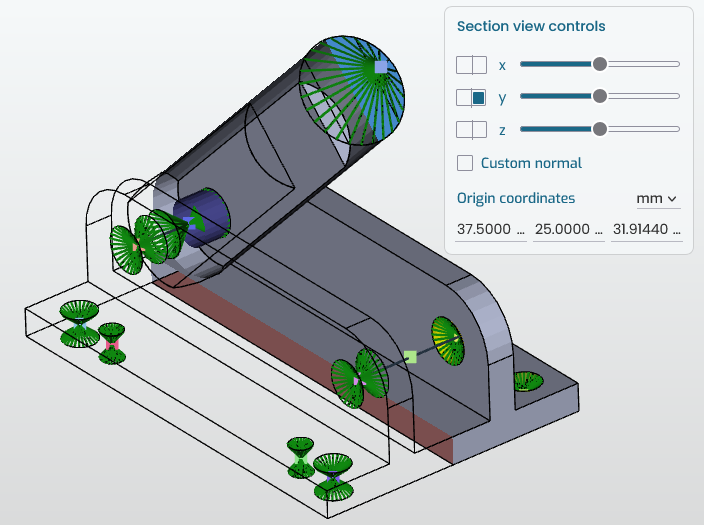
Fig. 4.4 Section view
4.3.2. Measure tool
The measure tool allows for fast computations of weighted centroids of geometrical entities. This is especially useful when defining Connections and their reference points.
Fig. 4.5 shows an example of how it can be use to find the centroid of a group of surface sets using the selection filter input.
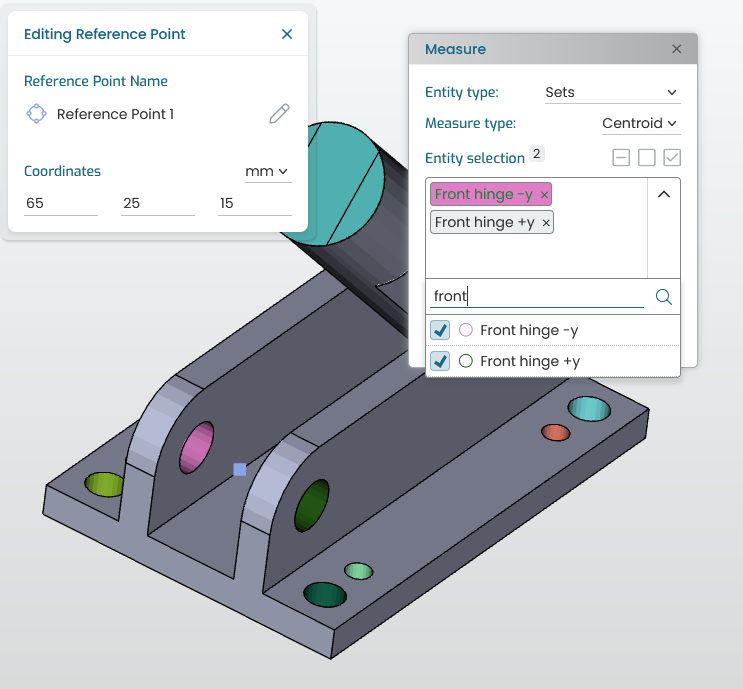
Fig. 4.5 Measure tool
This tool takes an entity type, a measure type, and a selection of geometrical entities. The following measures can be computed:
- For a selection of reference points:
centroid
- For a selection of surface sets:
centroid
area
- For a selection of volumes:
centroid
volume
The Measure tool results includes a dropdown selection of the output units, and two quick action buttons for copying the result into the clipboard, or creating a reference point when relevant.
Fig. 4.6 Measure tool results
Note
The measure tool or some of its options might not be available for geometries that were imported with older versions.